Smartocto Insights allows you to assess your content performance from multiple angles and dimensions. If you ever wanted to compare two different periods of time and evaluate your successes, you should look no further than the Compare function, which can be accessed through Insights > Compare:

On the Compare page, you are able to compare performance under different metrics on Section, Topics, and Author level:

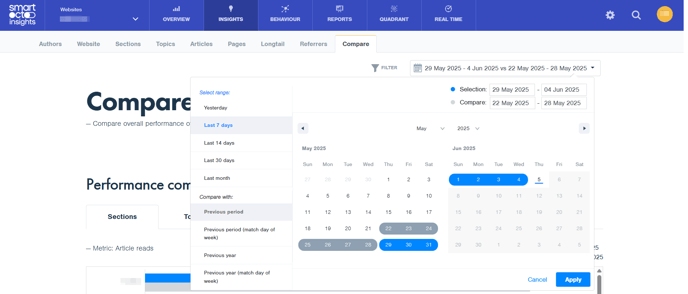
The Compare page includes a specialised date picker which allows you to select the two periods you would like to compare. The base period is coloured grey, while the compare period is coloured blue:
The results will be displayed in a dedicated Performance graph with custom tooltips:

Best practices 💭
Let's say that you have a strategy to increase the number of published stories in the lifestyle section because you want to attract a larger audience. With Compare, you can now compare how your various outputs are performing, and ask the all-important question: are they bringing you the results you expect?
The same goes for User Needs. If you want to produce more emotion-driven content because you’ve noticed that it spikes engagement, you can evaluate your strategy by comparing results, week by week, or in different selected periods.
Compare also allows you to evaluate performance by Sections, Topics, and Authors through well-known metrics such as Article Reads, Attention Time, Read Depth, Page Depth, etc. For a better understanding of the impact, you can filter on different dimensions such as User Needs, article types, device type, etc.
Additional options
The compare function offers plenty more - multiple additional options that can be found on the Compare page are listed below and explained in detail:
- Utilise full filter functionality, choose the perspective you prefer and segment traffic to your liking (to read more on perspectives, visit this article)

- Multiple preset options on the date picker, along with the option to automatically compare with the previous period (depending on which period you have selected)

- Full data table, with additional sorting options (Notice that when you click on the required metric in the full data table, the main metric in the performance graph on top of the page will be automatically adjusted as well)

- Export the complete result set (csv format) and choose to Include or exclude groups (Subsections)

- Choose to include data for all content that generated traffic during the selected period, or only for content published during the selected time period

For all questions and uncertainties, feel free to reach out to your Customer Success Manager or to the smartocto support team at support@smartocto.com