![SO-logo_line_RGB.png]](https://knowledgebase.smartocto.com/hs-fs/hubfs/SO-logo_line_RGB.png?height=40&name=SO-logo_line_RGB.png)
How to access Waves
To access the Waves dashboard, go to your organisation-specific URL ending in
-waves.smartocto.com.
Usually, if you have Realtime access, you will have access to Waves. If you don’t have access to Waves please contact your admin or send an email to support@smartocto.com
How to create a Waves dashboard
1. Open the site and click on Create Dashboard button
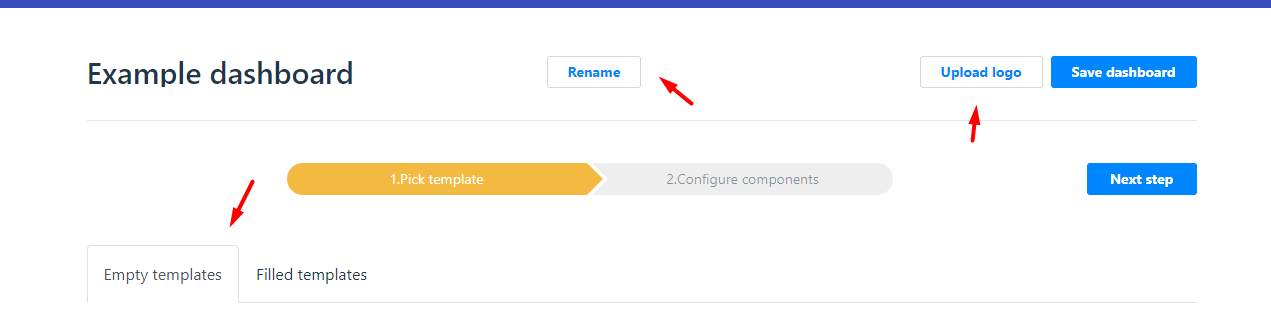
2. In 1. Pick template you can rename your dashboard and if you have, upload logo which will be present on your dashboard
3
. Choose between two types of dashboard Empty templates or Filled templates
- In Empty templates, you create dashboards from scratch, choosing which data you want to see.
- In Filled templates, you create new dashboards from existing dashboards, (if for example you have a dashboard for business news and you want to see the same type of data but from a different section, sport for example)
NOTE: You cannot use filled templates if there are not already existing dashboards, there are no pre-set templates.
4. In Empty templates choose the appearance of your dashboard
5. In 2. Configure components you choose which data you want to see and where it will be located on the dashboard. They are separated into components
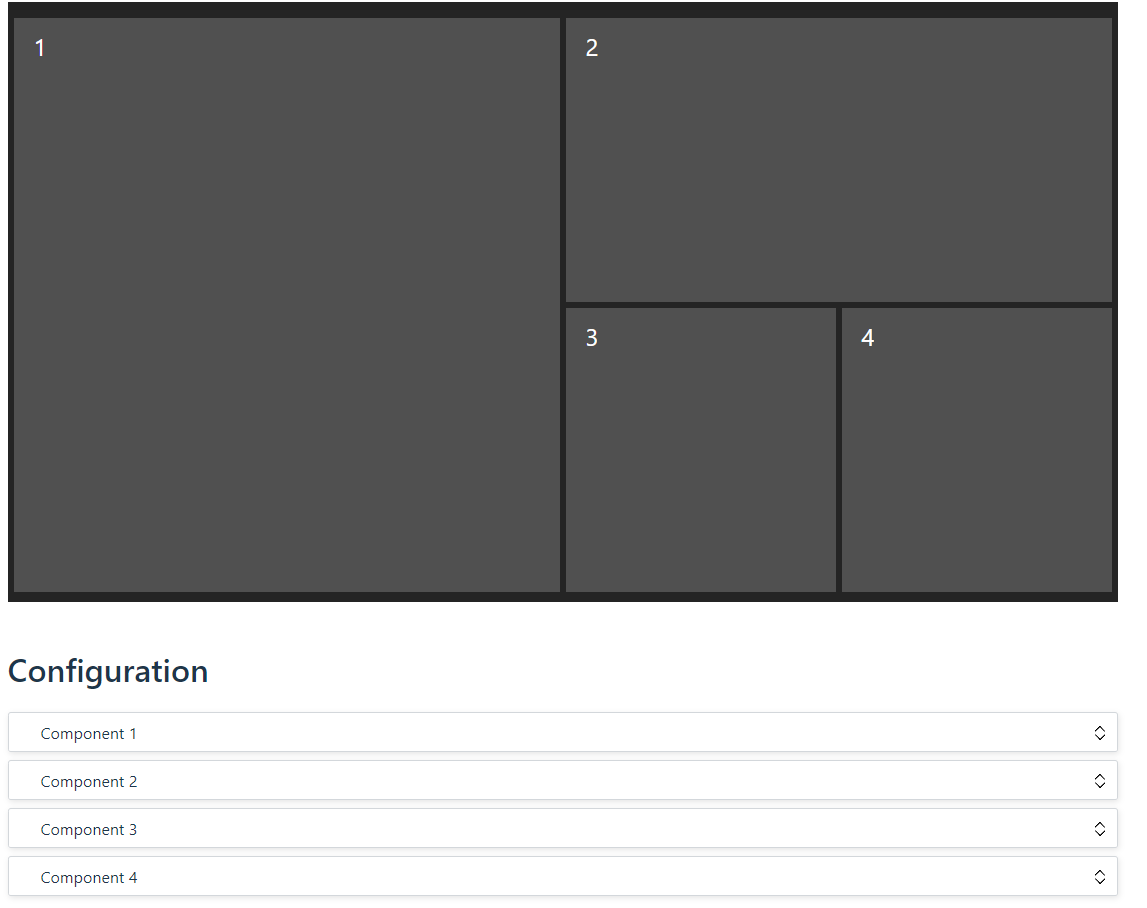
6. Click the Component 1 expand button on the right side and select one of the available component types:
- Add list — shows App, Brand, and Social networks columns (up to 6). You can sort by ascending or descending order, set a time window, and filter by Brands or specific sections of the site. Set a display name using the Label name field — this name appears on the dashboard and helps you identify the component at a glance. To deselect an option, click the Remove button.
- Add video list — shows your video data on the site and the app. Supports the same sorting and filtering options as Add list.
- Add notification center — shows actions and updates from your Realtime Stream. To learn more, see: What are Stream and Notifications.
- Add single metric — shows data for a single metric of your choice, such as average reading time and much more, selected from the drop-down menu.
- Add chart — shows a chart of Story views, Video views, Conversions, and overall content performance metrics.
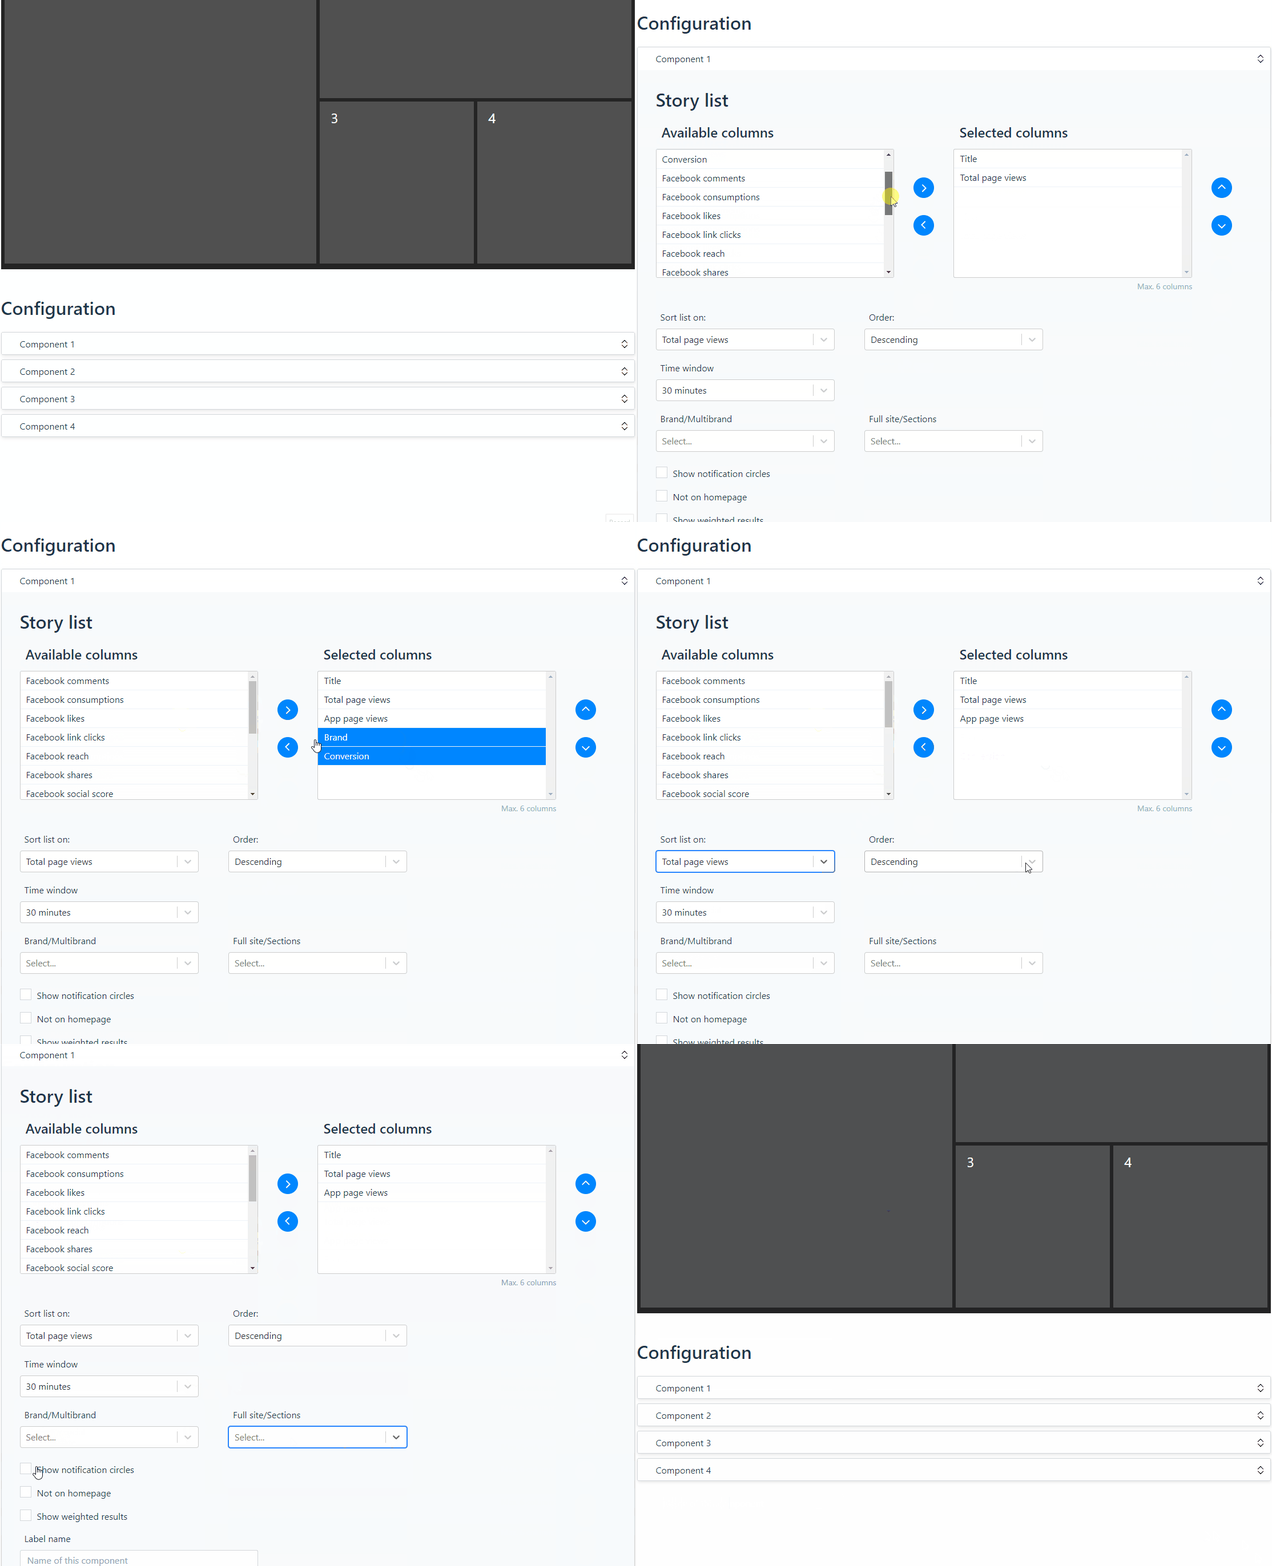
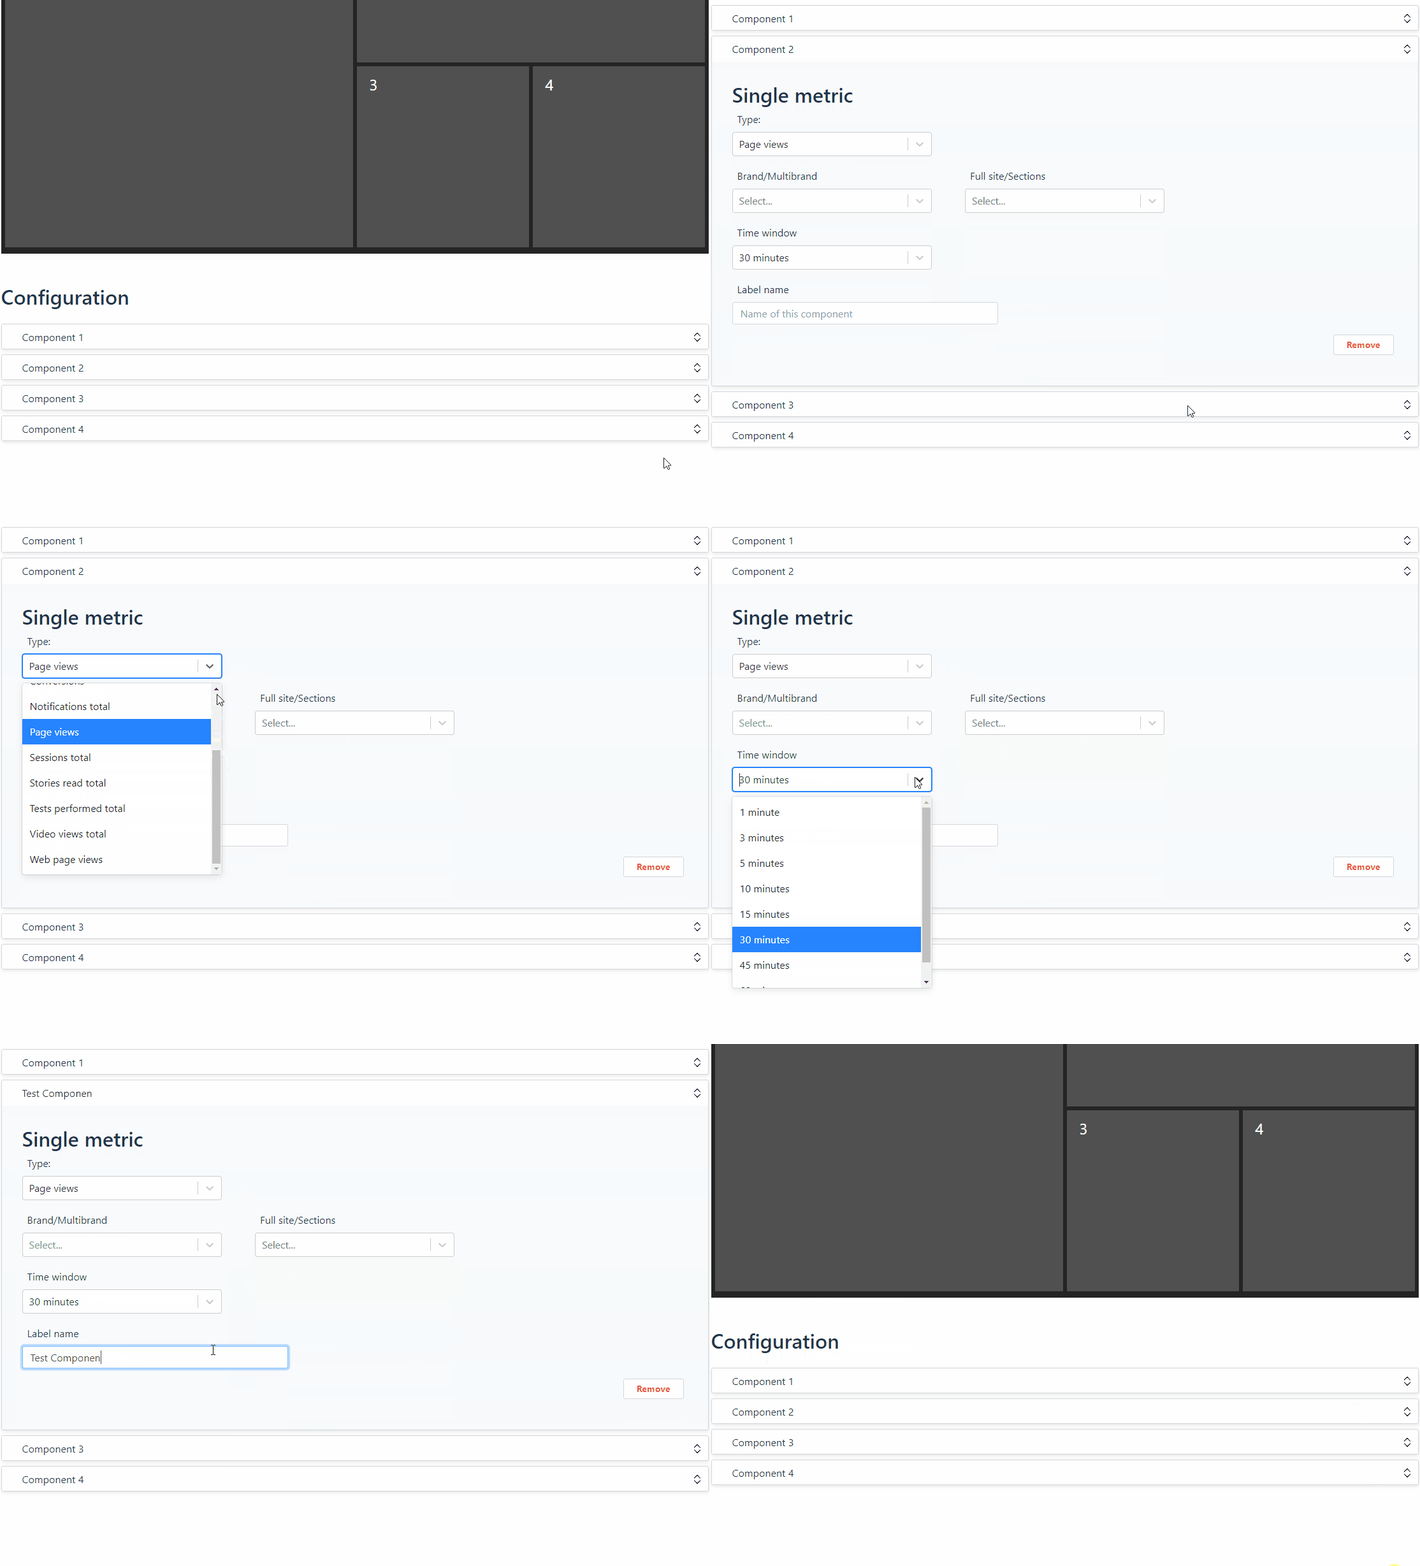
Note: Depending on the dashboard appearance you selected in step 4, Add single metric and Add chart are not available in Component 1 but are available in all other components.
7. Once you set up your components with data in the top right corner click on Save dashboard. You can access that dashboard from the list on the main page. Also, that newly created dashboard will be seen in Filled templates and can be used as a template to create new dashboards