1. Select the Report section and click New Report
2. In Step 1: Setup Details, select CPI Perspective, to read more about CPI Perspective, click on this link
You can choose between:
Article perspective - CPI is always calculated on the article level and its values are distributed across authors, sections, and topics by taking in mind your chosen period.
Traffic perspective - CPI focuses on the traffic of selected dimensions (article/author/section/topic/referrer) from the chosen period.
3. Select Report Frequency, Data period you want to gather, and to whom you want the report to be sent.
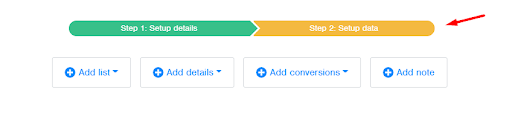
4. In Step 2: Setup Data select Data you want in your report:
In Add list, you can select which list you want in your report (Section, Topic, Article, Referrer, and Author)
In Add details, you can see some specific performances on Website, Section, Article, Topic, Longtail and, Author level
In Add conversions, you can see a list of articles that are converting your readers (if you have a subscription option)
In Add note, you can create notes for your reports (this can be especially useful if you are sending report to colleagues that are not familiar with your reports)
5. Once you have selected a list, select columns in the Available Columns section you want to have in your report. You can either double click or press the left and right arrows to add or remove columns to the Selected columns section. You can also press and hold to select multiple columns to mark them for adding.
6. In Selected Columns, you can sort your columns so you can customize how your report will look like. Note that the first column in the Selected columns section will be the first in your report, in this case, the Loyalty marker will be the first then Title, etc. You can select the column and press up and down arrows to change their place in the report.
7. In the Sort by section, you can sort metrics for your report. You can add additional sort levels if you want more detailed information.
8. In the Limit section, you can set how many articles you want to see in the report, the range is from 10 to 100.
9. In the Thresholds section, you can filter certain values for a more precise presentation.
In the example below, we want to see only articles with CPI higher than 650 and with more than 1500 reads.
10. In the Filter section, you can filter which articles you want to see (with a specific topic, specific author, etc.). You can also click on the option Include all content which will select all articles and add them, but only if selected CPI Perspective is Traffic. To read more on Include all content, navigate back to Insights Reports > Include All content
11. In the Block label, you can name that part of the report.
12. If you are all set with adding lists, details, conversions, and notes, on the top of the page click Preview Report if you want to see how the report will look like and if you are satisfied with the result click Save Report. Reports will be sent at 6 AM the next day in your local time zone.