App page views
App page views is a metric that shows the amount of views a story got in the selected period based on the selected filters.
App visitors
App visitors is a metric that shows how many unique visitors viewed the stories via your app. This is available when smartocto Real time tracking is used.
Avg. read depth
Avg. read depth is a metric that reveals how deeply a visitor has got into reading a piece of content. It takes into consideration true attention time, length of the text, scroll-depth, and the average time it takes for a reader to consume the content. It analyzes only the article main content on the page, disregarding all other elements.
Example
- An article contains 450 words
- Average read speed 300 words per minute
- Time needed to read the entire article is 90 seconds ([450/300] *60 seconds)
- Measured Attention time is 120 seconds.
- The maximum measured scroll position is 25%
- The shown read depth in smartocto is 25%
Example explanation
For a text of 450 words - where you can read on average 300 words per minute - the visitor needs 90 seconds of accumulated attention time to say that it read 100%. Given the metrics from the example - and looking from the attention time point of view - it is determined you spent more time than needed (120 seconds instead of the needed 90 seconds). So based on attention time the visitor read the whole text.
However since the maximum scroll position that was measured with the tracker was just 25%, that percentage is selected as read depth percentage. This percentage is shown because - although attention time spent was enough - the visitor never actually scrolled below that % of the article, meaning the visitor did not see the rest of the article.
Avg. reading Time
Avg. reading time calculates the time a user actually spends on the page reading the content. This is what we in the industry often refer to as "engaged time". It doesn't count 'idle time' - i.e. those seven minutes you left to make a cup of coffee and left the browser window open.
Avg. scroll depth
Avg. scroll depth shows where readers left the visited page.
Brand
Brand is a dimension of the story which shows to which brand the read story belongs. In case a story is published on multiple brands, you can see which brands version is highlighted.
Conversion
Conversion is a metric to indicate how many conversion the story received in the selected period
Facebook comments
Facebook comments is a metric which tells you how many comments a story received on posts by the brand on Facebook. Comments on posts which are not posted by the brand, for example by some person or a not-owned Facebook-page, are not counted.
The link click is received from Facebook Analytics
Facebook consumptions
Facebook consumptions is a metric which tells you how many consumptions were counted on a story posted by the brand at Facebook. A consumption holds every click on a post, which can be a click on a comment or a picture or a link. Consumptions on posts which are not posted by the brand, for example by some person or a not-owned Facebook-page, are not counted.
The link click is received from Facebook Analytics
Facebook likes
Facebook likes is a metric which tells you how many likes (including the emojis) a story received on posts by the brand on Facebook. Likes on posts which are not posted by the brand, for example by some person or a not-owned Facebook-page, are not counted.
The link click is received from Facebook Analytics
Facebook link clicks
Facebook link clicks is a metric which tells you how many likes (including the emojis) a story received on posts by the brand on Facebook. A link click is counted by Facebook when some viewer of the post clicks on the link. Link clicks on posts which are not posted by the brand, for example by some person or a not-owned Facebook-page, are not counted.
The Facebook link clicks information is received from Facebook Analytics
Facebook shares
Facebook shares is a metric which tells you how many likes (including the emojis) a story received on posts by the brand on Facebook. Shares on posts which are not posted by the brand, for example by some person or a not-owned Facebook-page, are not counted.
Facebook social score
Facebook social score is the sum of Facebook comments, Facebook shares and Facebook likes.
Section
Section shows the section to which a story belongs
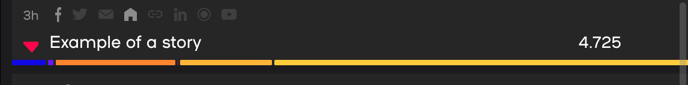
Title
Title includes the story headline as seen on the story page. This element includes the age of the story and icons which show the used channels for distribution.
Below the icons and headline the trend is indicated with a green or red triangle next to the title of the story. This trend indicator compares the reach to the same period, before the period. In case you're looking at the data period of the recent hour, the trend indicator compares the reach to the period 2 hours ago up to 1 hour ago.
At the bottom the colored bars show a breakdown of the traffic by channels.
Regardless the selected metrics, the traffic-bars and channel-icons are always included in this element.
Total page views
Total page views is the sum of the App page views and Web page views.
Web page views
App page views is a metric that shows the amount of views a story got in the selected period based on the selected filters.
Web visitors
Web visitors is a metric that shows how many unique visitors viewed the stories via your website. This is available when smartocto Real time tracking is used.