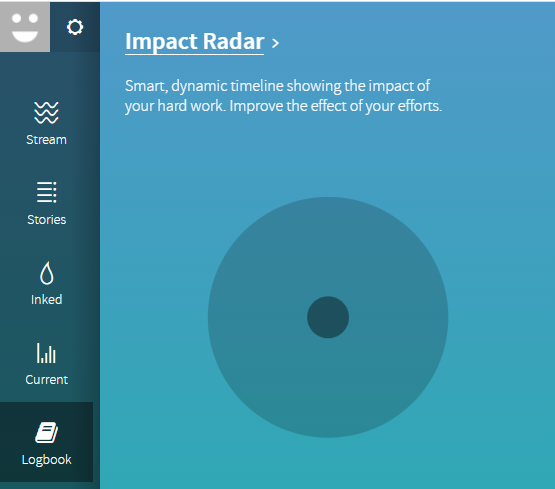
Impact radar is one of the Logbooks sections that help you see when do you post stories on social media and how effective they are.
With this analysis, you can better organize posting and maximize your traffic on social media.
To check Impact Radar:
1. Go to Logbook > Impact Radar
2. Below Select Week there is a blue rectangle with week number and year, click on it to select week and year. You can only select the whole week. Clicking on the smaller arrow lets you change weeks and a bigger arrow lets you change years.
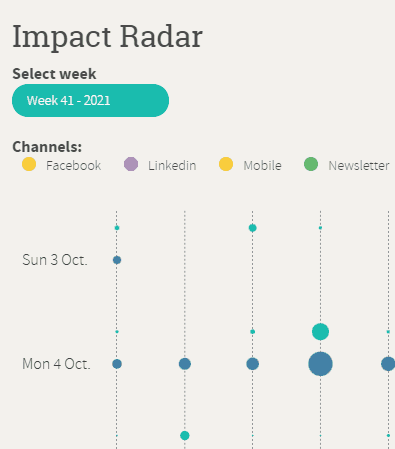
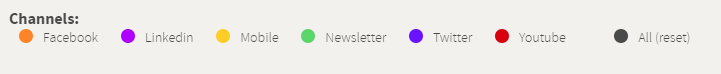
3. Channels will let you choose which social network you want to see. Clicking on one of the available social networks you can filter data just for it. Clicking on All it will accumulate all the data for every social network.
Where most channels are distribution channels with traffic to your website, the channel Mobile is aimed at traffic on your mobile-app. When selecting this channel, you'll see the spread of published stories in your mobile-app, and the views of your content in your app.
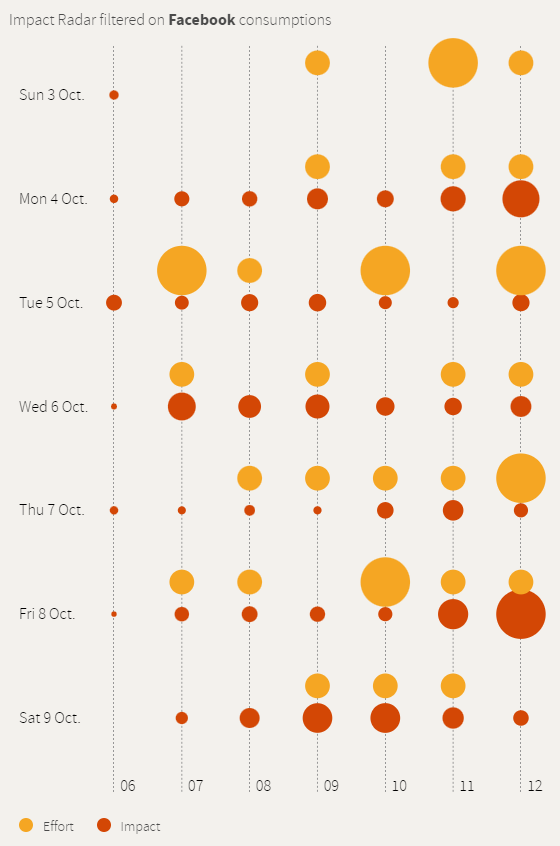
4. When you click on the selected social network, Impact Radar tells you which network you selected and changes colors appropriately.
On the left side of the graph, you will see dates and on the bottom, you will see the time. In the lower-left corner, you will see an explanation of which color is Effort and which is Impact.
Effort represents how many posts and publications you performed on social media or other channels. And Impact when you earned the most traffic on your posts and publications. Looking at the example below, on Friday 8th of October at 12 pm, somebody made little Effort posting on social media but there was a lot of Impact (traffic). There is no direct link between the effort and the impact, but it does show that at 12 pm there was the most traffic generated of the entire week.
With this data now you will know when and how to organize your posting on social media according to the traffic.