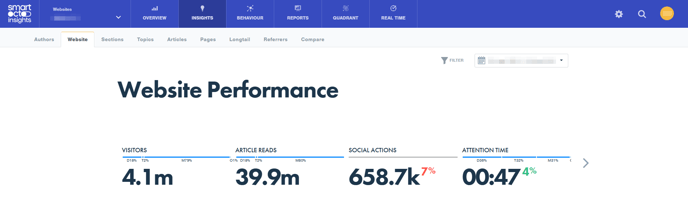
Similarly like on the Overview Page, on top you will see the carousel of metrics, displaying the numbers along with the red and green percentages, which will appear whenever there is a trend of growth or decline with a metric in question.
Keep in mind that all of the numbers (and coloured percentages) are closely tied to the data period that has been selected on the date-picker, in the top right corner.
Daily performance
The next thing that you will come across on the Website performance page is the Daily performance graph, where you will be able to track the CPI scores of your total traffic day-by-day:
Pro Tip: Try to notice patterns and use the Daily performance graph to see if your desired strategies are paying off once implemented.
Performance correlations
The Website performance page can also be utilised to find performance correlations between different metrics. Use the drop-down menu to spot correlations between e.g. Article reads and Social actions. Or perhaps, New visitors and Loyal visitors: the graph is yours to play around with.

Pro tip: The big dots on the graph will reveal the articles that have contributed the most to the high peaks and low points in the graph.
Read depth
The Read depth block, along with the detailed Read depth breakdown, will show you the percentages of readers who Left your articles quickly (read up to 1/10), spent some time reading (2-9/10), and Finished reading your articles (10/10).
Pro tip: hover over the question mark circles next to the percentage descriptions to see a detailed explanation.
New articles performance
This is where you are able to see colour-coded comparisons between the Newly published articles and the previous period in terms of key metrics (Article reads, Read depth, Social actions, Number of Articles, Attention time, Page depth):
 Pro tip: Visit the Metrics Knowledgebase article to refresh your knowledge about the key smartocto metrics and how they are calculated.
On the bottom of the Website Performance page, you will find the Full data table of Performance stats, that will allow you to sort Authors/Sections/Topics/Articles/Referrers by Article reads/Visitors/Social actions/Attention time/Articles.